Help!
Cheatsheets

Cheatsheets are great for refreshing your memory and finding new functions and plots to use.
- In RStudio go to
Help > Cheatsheets >- Data Transformation - Helpful functions for cleaning and arranging your data.
- Data Visualization - Great reference for all your
ggplot’ing options.
- Data Transformation - Helpful functions for cleaning and arranging your data.
Learn more R
From your browser
- Charts & Plots Intro - Review ggplot2 and dplyr functions with country data
- RStudio interactive lessons: Summarizing data
- RStudio Visualization primers
- RStudio videos: Programming basics
- Coursera classes: John Hopkins courses w/ Roger Peng
From within R
Find new packages and functions
- Search packages in R with CRANsearcher
- ROpenSci has packages and data for all types of environmental and “scientific” work.
- For water the USGS shares water quality focused packages on GitHub.
Books
- R for Data Science: comprehensive & free book online.
Searching online
- google.com: include
rorrstats+the question - stackoverflow.com + use the
[r]tag
Inside R
- Get function and package help from the console with:
?arrange()orhelp(dplyr)
Email us!
- Post a question to MPCA’s R-questions
- Ask us!
Troubleshooting
These are a few of the things we personally forget to do all the time and cause 90% of our errors. They’re good first checks if R starts throwing errors or behaving strangely.
- Check that all parentheses are balanced so that every opening
(has a corresponding closing). - R doesn’t love
\backward slashes like Windows, check that they didn’t sneak into your expression somewhere. When in doubt use the/forward slash. If you think you have completed typing your code, and instead of seeing the
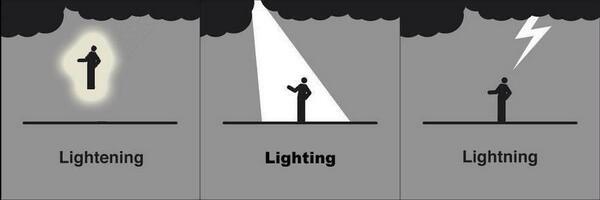
>command prompt at the console you see the+character instead. That’s a good sign that either R is still thinking very-very hard, or it is still waiting for you to complete your expression. You can hitEscorCtrl-Cto force your way back to the console and try typing your code again.R is very picking about spelling. So are meteorologists when talking about lighting storms.
- In
ggplotwe build up plots one piece at a time by adding expressions to one another with the+character. When doing this, make sure the+goes at the end of each line, and not the beginning.
Put the + sign here to make ggplot happy:
ggplot(data = mpg, aes(x = displ, y = hwy)) +
    geom_point()
Put it on the next line to make ggplot sad:
ggplot(data = mpg, aes(x = displ, y = hwy))
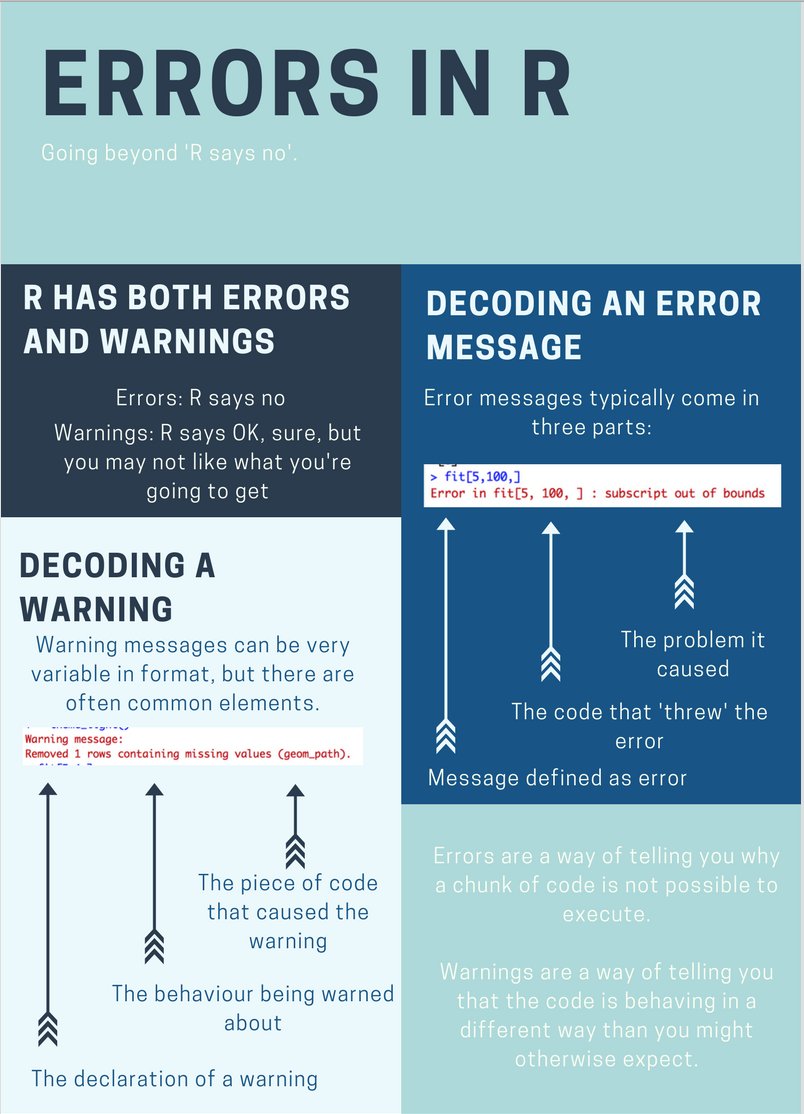
+ geom_point()Error messages
Not all error messages are helpful or easy to interpret, but they do seem to be getting better in many R packages. When googling an error message it can help to put the entire message in quotes. For the error below we would search for "Error in fit[5, 100, ] : subscript out of bounds".